
Antwerp QC, Much of Belgian Core, Leaves Competitive Quidditch

Credit: Aurélie Lee
Close followers of The Eighth Man will be familiar with our USQ Elo Standings we have tracked for the past year and a half. This summer, in anticipation of the IQA’s World Cup in Florence, we are excited to bring you our initial presentation of International Elo Ratings.
For those unfamiliar with our Elo system, a thorough description can be found here. The main idea of an Elo rating system is to use a historical record of every game a team has played to determine how strong that team is compared to the average team in their realm of competition. Teams are compared to an “average team” (in this case, a team with a rating of 1500) and the farther from average the team is, the better or worse. Every match between two teams results in the winner’s rating increasing by a certain amount of points, and the loser’s decreasing by that same amount—a zero-sum system. The amount of points a team gains or loses is based on three factors:
- Likeliness to win the game
Before a match up, the two teams’s Elo ratings are compared, and each team is given a probability of winning the matchup. The closer the results of the matchup align with that probability, the less points are exchanged in the teams’s ratings. Put another way: If a high-ranked team beats a low-ranked team, their ratings barely change. If a low-ranked team beats a high-ranked team, their ratings shift much more dramatically. - Margin of victory
All other things equal, a win by 10 points will result in a smaller rating increase than a win by 50. This margin multiplier is based on the USQ SWIM calculations, which means that blowout wins with quaffle point differences greater than 80 result in a team’s multiplier increasing at a slower and slower rate the more points they score. - An external applied multiplier
This is the main difference between the algorithm used for our USQ Elo system and the algorithm we use here for international play. This multiplier allows the change in rating to be based on the importance of the game. For this program, IQA World Cup games are given a multiplier of 1.8, continental tournament games are given a multiplier of 1.2 and international friendlies are given a multiplier of 0.8. To make up for the fact that fewer games are played at an international level, these multipliers (except friendlies) are all higher than those used in our USQ ratings, making this system jumpier and more sensitive to a country’s recent performance.
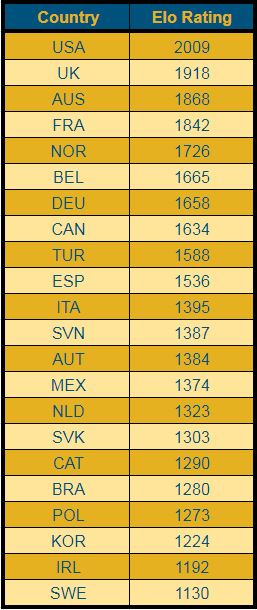
Based on all this, we present our current Elo standings for each of the 22 teams that have participated in an international tournament. Predictably, the US National Team, U.K., Australia and France sit atop the rankings by a wide margin, followed by Norway, Belgium and Germany, respectively. Several things should be noted in these ratings:
- The U.S. is far and away on top, despite not being the current international champions, and that is almost certainly correct. The U.S. has only one loss in 20 international appearances and, even then, by only 20 points. Australia jumped significantly in their gold-medal win against the U.S., but not by enough to jump ahead of them. Australia would need to win that game four more times in order to take the lead in these rankings (assuming a 20-point margin of victory in each game).
- Teams that have competed in more international games have a more e accurate Elo rating. It’s likely that the U.S. and Australia (as well as Canada, but to a smaller degree) are underrated by these Elo ratings when compared to European teams who have played close to twice as many games, thanks to the 2015 and 2017 European Games. Essentially, this data is two years out-of-date on the Dropbears and USNT, while only being a year out-of-date for the U.K. and France. The upcoming World Cup will certainly help to more accurately sort teams.
- Unlike what takes place in the USQ rating system, every national team starts with a rating of 1500. While this is almost certainly an overinflated rating for teams that are just now joining the field, it is necessary to keep the average at 1500 because there is no seasonal readjustment that takes place. The rating Norway finished with after the 2017 European Games is the rating it will take into the 2018 World Cup, and likewise for every other team in these rankings.
- No relevant friendly scores were able to be found, and, thus, none are reflected in these ratings.
Based on these ratings, and the announced tournament format, it is clear that whatever country is placed in the “G1” position ahead of Mexico will gain an enormous advantage on day one. The teams placed in A1-F1 will all play a team ranked somewhere in the top eight, but thanks to Mexico’s 2016 upset over Norway to make the World Cup quarterfinals, whatever team draws “G1” could conceivably play no teams ranked higher than 14th in pool play.
For a more complete history of each country’s Elo rating, check out the graph linked below.
Archives by Month:
- April 2025
- May 2023
- April 2023
- April 2022
- January 2021
- October 2020
- September 2020
- July 2020
- May 2020
- April 2020
- March 2020
- February 2020
- January 2020
- December 2019
- November 2019
- October 2019
- August 2019
- April 2019
- March 2019
- February 2019
- January 2019
- November 2018
- October 2018
- September 2018
- August 2018
- July 2018
- June 2018
- April 2018
- March 2018
- February 2018
- January 2018
- November 2017
- October 2017
- July 2017
- June 2017
- May 2017
- April 2017
- March 2017
- February 2017
- January 2017
- December 2016
- November 2016
- October 2016
- September 2016
- August 2016
- July 2016
- June 2016
- May 2016
- April 2016
- March 2016
- February 2016
- January 2016
- December 2015
- November 2015
- October 2015
- September 2015
- August 2015
- July 2015
- June 2015
- May 2015
- April 2015
- March 2015
- February 2015
- January 2015
- December 2014
- November 2014
- October 2014
- September 2014
- August 2014
- July 2014
- May 2014
- April 2014
- March 2014
- February 2014
- January 2014
- November 2013
- October 2013
- September 2013
- August 2013
- July 2013
- June 2013
- May 2013
- April 2013
- March 2013
- February 2013
- January 2013
- December 2012
- November 2012
- October 2012
Archives by Subject:
- Categories
- Awards
- College/Community Split
- Column
- Community Teams
- Countdown to Columbia
- DIY
- Drills
- Elo Rankings
- Fantasy Fantasy Tournaments
- Game & Tournament Reports
- General
- History Of
- International
- IQA World Cup
- Major League Quidditch
- March Madness
- Matches of the Decade
- Monday Water Cooler
- News
- Positional Strategy
- Press Release
- Profiles
- Quidditch Australia
- Rankings Wrap-Up
- Referees
- Rock Hill Roll Call
- Rules and Policy
- Statistic
- Strategy
- Team Management
- Team USA
- The Pitch
- The Quidditch Lens
- Top 10 College
- Top 10 Community
- Top 20
- Uncategorized
- US Quarantine Cup
- US Quidditch Cup