
Antwerp QC, Much of Belgian Core, Leaves Competitive Quidditch
The Eighth Man Elo Standings are back for another year, building on more or less the same rules we have followed in the past—with a few key changes. Over the offseason, we took a look at the data gathered from more than six seasons and nearly 8,500 games and made a couple tweaks to enhance the algorithm we’ve used.
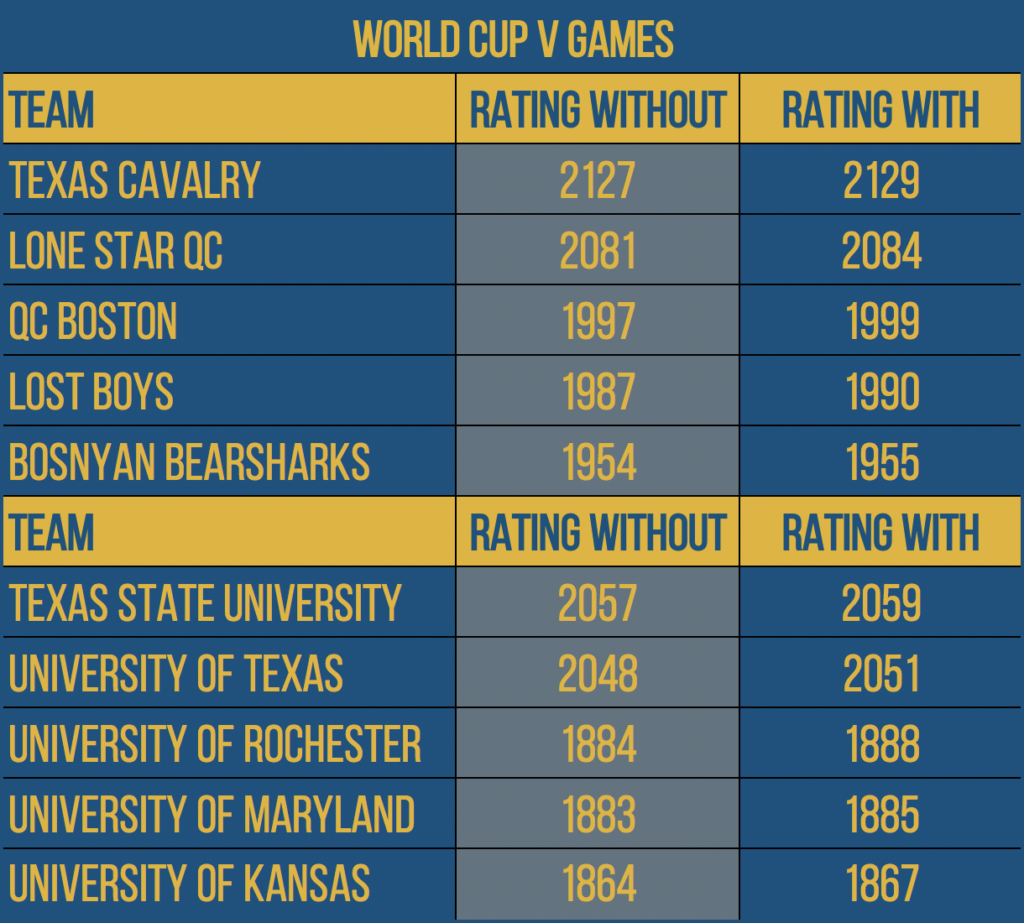
Change 1) We added all the games from IQA World Cup V.
This is one of the smallest changes we made in terms of how it reflects on the ratings of modern teams, due to how long ago these games took place. That said, this change will predominantly affect the accuracy of where the ratings stood during earlier seasons, allowing us to better reflect on those seasons when we do historical Elo analyses. How this alternation affects ratings for the top-five club and college teams can be seen below.
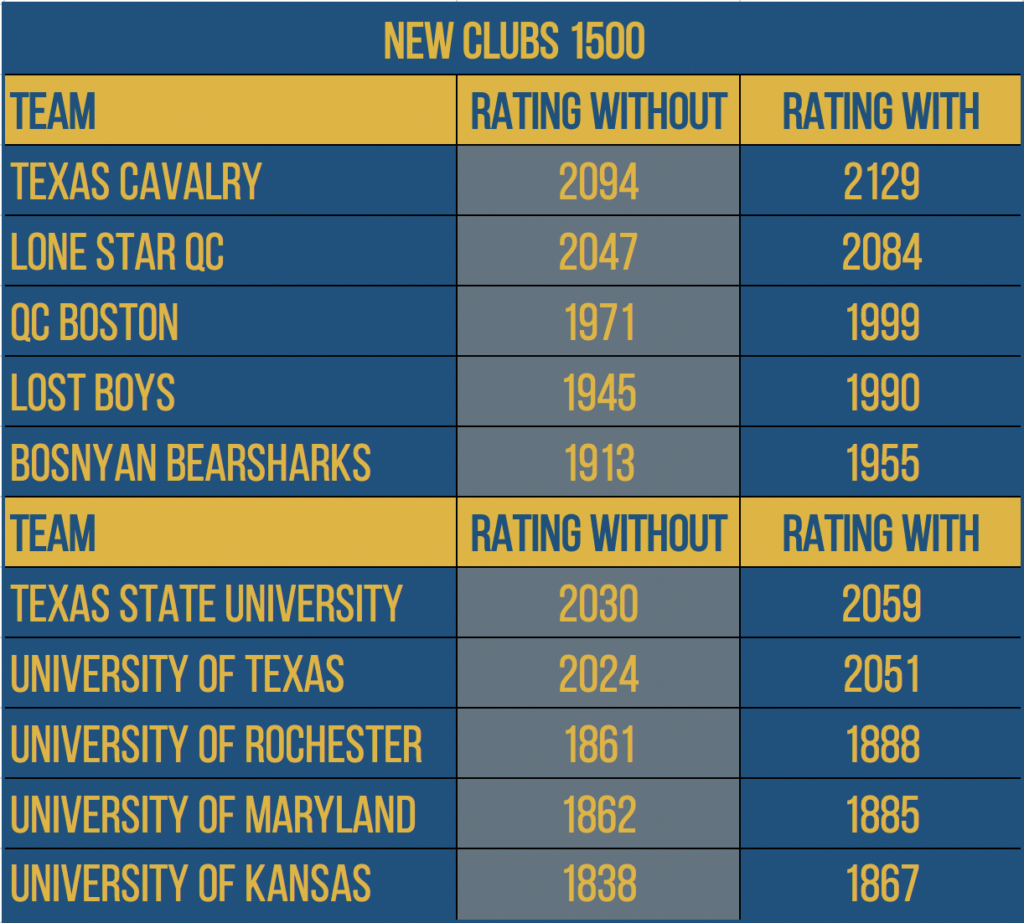
Change 2) We changed new club teams’s ratings from 1300 to 1500.
Previously, every new team that joined the league would enter with an Elo rating of 1300 (roughly 200 points below average). Common sense would tell you that while that may hold true for new college teams (it does), it is likely a bad approximation for new club teams, many of which enter as “superteams” of recent graduates. After looking at our algorithm, we found that the best approximation for a new club team is a rating of roughly 1540. To keep things running cleanly, we’ve retroactively updated every club team’s initial Elo rating to 1500, and will do so for every club team moving forward. This means that historic Elo ratings referenced in previous articles and posts will no longer be accurate based on modern standards, but all future references to historic Elo ratings will now reflect this change. How this changes things for the top-five club and college teams is reflected below.
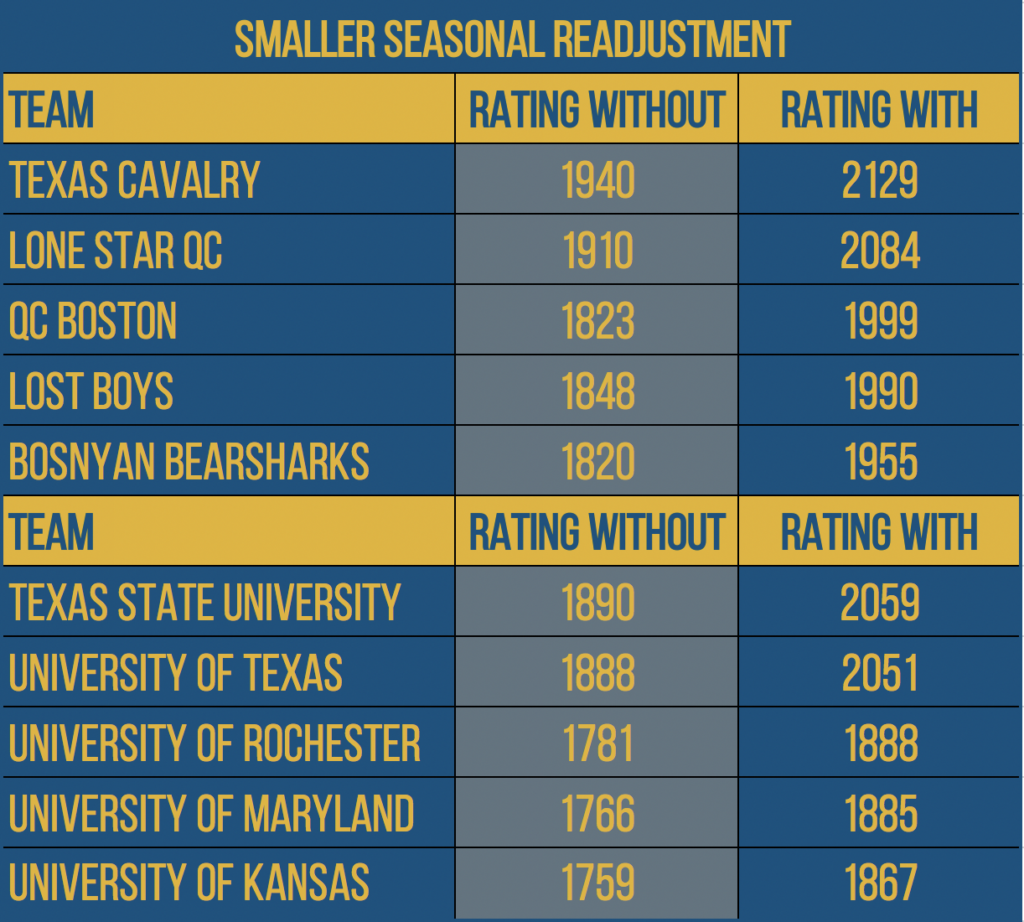
Change 3) We relaxed seasonal readjustment from one-third to one-sixth toward the mean.
Previously, between every season, each team had their end of season reverted toward the mean—estimated at 1500—by one-third. Practically speaking, this means that if a team’s Elo was 300 points above 1500, it would be dropped 100 points before the next season. If their Elo was 90 points below 1500, it would be raised 30 points before the next season, and as such for each team. This was primarily to adjust for the inherent randomness a team’s roster would go through from season to season. Some teams would lose good players, others would improve over time, but in general, the average team converged toward the mean (the reason for this readjustment).
However, even a casual observer might observe that this effect has lessened as time has gone on. With the top of the sport increasing in talent and complexity, it is harder for new teams to find huge, season-changing talent in a recruiting class. Instead, talent is more and more frequently developed within programs that already have long-standing trends of success and deep pools of players to pull from when top talent leaves or graduates. Furthermore, the increase in the league’s proportion of club teams has decreased the amount of turnover seen in said teams. While no club team keeps the exact same roster from season to season, the lack of graduating players allows a team to keep the same core of talent for much longer than the average college team.
With all this taken into effect, an internal analysis of our algorithm showed that—on average—a team will only regress about one-ninth toward the mean in relative quality from one season to the next. In other words, bad teams tend to stay bad, and good teams tend to stay good for extended periods of time. So why are we using a one-sixth reversion instead of the more accurate one-ninth reversion the data gives us? For two main reasons:
Firstly, there is a huge amount of turnover in the USQ community—on average 33 teams leave the league every year (and take their Elo ratings with them) and 30 teams join. In the case of new collegiate teams, those teams are entering with an Elo rating far below average, and, thus, dropping the overall average of the league. In order to ensure that this average does not continually drop from year to year, we raised this readjustment to keep our true average closer to 1500, the average for which we’re adjusting.
Secondly, this effect is significantly more distributed than concentrated. Even for Texas Cavalry, the team that receives the heaviest readjustment from this change, their Elo is nearly 200 points higher with the adjustment reduced from one-third to one-sixth. Were our readjustment further softened to one-ninth, they would only gain an additional 40 points. This change is proportionate, so the order in which teams finished last season is preserved as we enter another, but the gaps between them have shrunk slightly.
How this changes things for the top-five club and college teams is reflected below.
Furthermore, several teams are essentially coming in as the same or similar teams from previous years, and thus will retain the Elo ratings of their predecessor teams. Those teams are Bobcat Quidditch (taking the Elo rating of the San Marcos Sharknados), Philadelphia Freedom (taking the Elo rating of the Philadelphia Honey Badgers) and Rochester Hailstorm (taking the Elo rating of Rochester United).
For anyone whose eyes glaze over when reading methods, we promise this will be the last Elo article that focuses on the pedantry of our algorithm for at least the next couple months. The parameters are all set, and our algorithm is now running full steam ahead, so be sure to check our Elo Standings throughout the season to see where your favorite team falls.
Archives by Month:
- May 2023
- April 2023
- April 2022
- January 2021
- October 2020
- September 2020
- July 2020
- May 2020
- April 2020
- March 2020
- February 2020
- January 2020
- December 2019
- November 2019
- October 2019
- August 2019
- April 2019
- March 2019
- February 2019
- January 2019
- November 2018
- October 2018
- September 2018
- August 2018
- July 2018
- June 2018
- April 2018
- March 2018
- February 2018
- January 2018
- November 2017
- October 2017
- July 2017
- June 2017
- May 2017
- April 2017
- March 2017
- February 2017
- January 2017
- December 2016
- November 2016
- October 2016
- September 2016
- August 2016
- July 2016
- June 2016
- May 2016
- April 2016
- March 2016
- February 2016
- January 2016
- December 2015
- November 2015
- October 2015
- September 2015
- August 2015
- July 2015
- June 2015
- May 2015
- April 2015
- March 2015
- February 2015
- January 2015
- December 2014
- November 2014
- October 2014
- September 2014
- August 2014
- July 2014
- May 2014
- April 2014
- March 2014
- February 2014
- January 2014
- November 2013
- October 2013
- September 2013
- August 2013
- July 2013
- June 2013
- May 2013
- April 2013
- March 2013
- February 2013
- January 2013
- December 2012
- November 2012
- October 2012
Archives by Subject:
- Categories
- Awards
- College/Community Split
- Column
- Community Teams
- Countdown to Columbia
- DIY
- Drills
- Elo Rankings
- Fantasy Fantasy Tournaments
- Game & Tournament Reports
- General
- History Of
- International
- IQA World Cup
- Major League Quidditch
- March Madness
- Matches of the Decade
- Monday Water Cooler
- News
- Positional Strategy
- Press Release
- Profiles
- Quidditch Australia
- Rankings Wrap-Up
- Referees
- Rock Hill Roll Call
- Rules and Policy
- Statistic
- Strategy
- Team Management
- Team USA
- The Pitch
- The Quidditch Lens
- Top 10 College
- Top 10 Community
- Top 20
- Uncategorized
- US Quarantine Cup
- US Quidditch Cup