
Antwerp QC, Much of Belgian Core, Leaves Competitive Quidditch
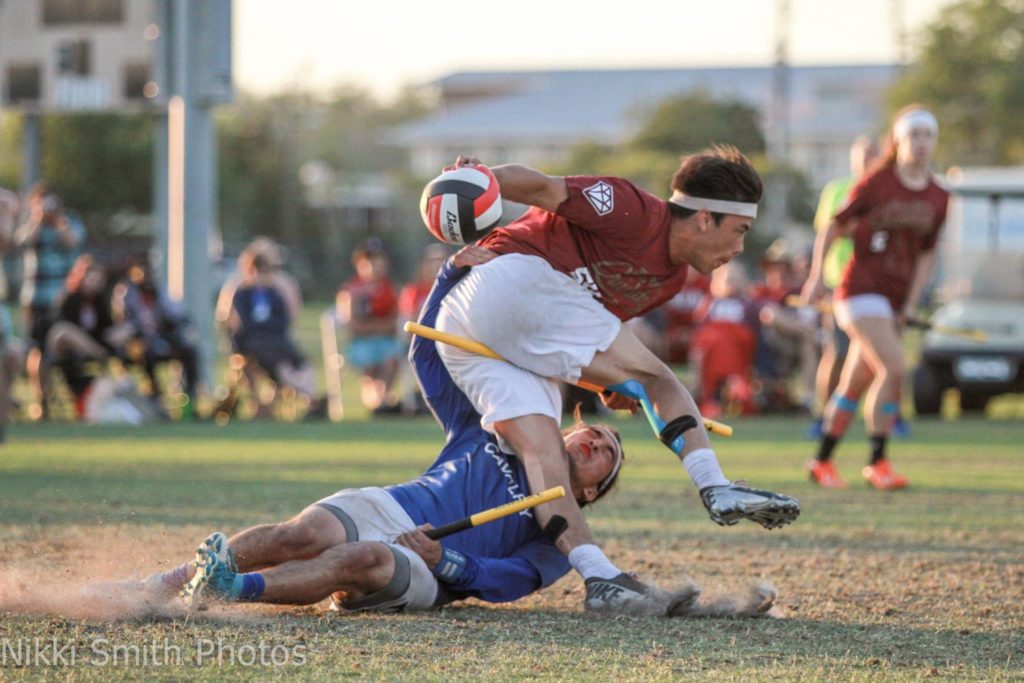
Credit: Nikki Smith
Too often in quidditch, a jam-packed tournament weekend featuring multiple pitches across multiple tournaments leaves fans, spectators and live-streamers wondering: Which of these games are worth watching and paying attention to? Certainly a team’s fans will gravitate toward spectating the games their side is playing in, but for general fans of the sport and those hoping to stream the best possible games for outside content, the question remains: Which games will be the most exciting to watch?
In the past, this decision has generally been made through that spectator’s subjective opinion—which games are good, which games are close and which games do people want to see. The system of what makes a match watchable can be sorted into two main factors, and at least one minor modifier depending on a spectator’s interests:
- How close the teams are. This makes intuitive sense to anybody who’s ever watched any sports match. No matter how talented the players on one team are, it’s always more exciting to watch a game where the end-result is in question for as much as the game as possible. Watching the 2014 USNT cut through the Global Games in Burnaby, Canada like a hot knife through butter may have been satisfying for U.S. fans, but for anybody else, watching their blowouts and similarly lopsided games causes a slow loss of interest.
- How good the teams are. Even if a game is close, it likely won’t be very exciting unless the teams playing are relatively high-quality. Two teams who have a slight talent disparity, but who play exciting high-level quidditch, will almost certainly be more exciting to watch than two equally-matched, low-quality teams who struggle to string a few passes together.
- How unique the matchup is (optional). While this may vary based on the slate of teams at an event, in general, a fresher matchup tends to offer more “new” information about a team and be more exciting to watch—it’s harder to get excited about two next-door-neighbor teams play their 10th matchup of the season. While this may not be necessary for regional tournaments where every other matchup may feature a local rivalry, this is certainly a valid contributor in looking at national tournaments that may pull in a wide array of novel pairings.
Those three factors by themselves are pretty easy to understand, and nearly every spectator has likely done some sort of quick mental juggling of them at some point. However, this process gets harder as the amount of teams increases and the spectator’s knowledge of those teams thins. At a two-pitch tournament, a fan might instinctively choose the most exciting matchup to watch more often than not, but when a tournament like Nationals happens and 16-20 teams from across the country are playing at the same time, the options may seem overwhelming. Clearly, there needs to be some kind of system in place for objectively predicting the most exciting matchups based on the factors listed above. Fortunately, everything listed above can either be counted or quantified by Elo, and from there, a formula can be made.
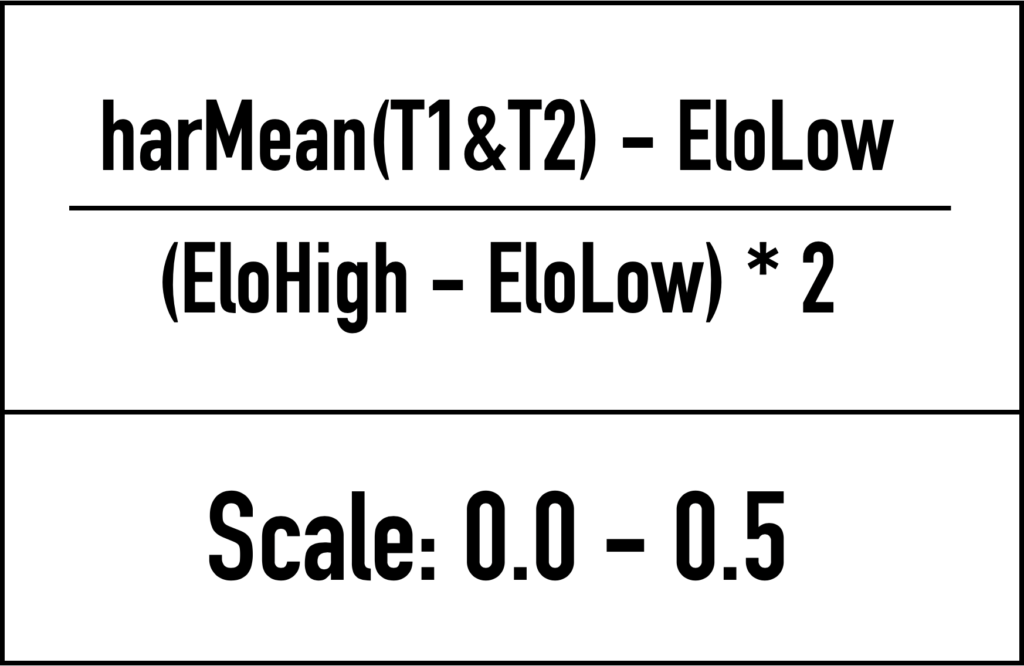
Matchup Quality: Take the harmonic mean (HarMean) of the Elo rating of the two teams playing (T1 and T2). This gives you an average of the two teams’s ratings that skews more toward the lower of the two than just a regular arithmetic mean would. While either could work, using a HarMean ensures that when a very high-rated team plays a very low-rated team, the game doesn’t appear to be more exciting than it really is simply because the higher team’s rating skews the average in their direction. From there, apply an adjustment factor so that the total range of possible means goes from 0 (lowest-rated team at an event playing the highest-rated team) to 0.5 (the highest-rated team playing a hypothetical equally high-rated team), so that this can be used in the “Excitement Index”, and you’re off to the races. That adjustment factor is accomplished by subtracting the rating of the lowest-rated team (EloLow) at the event from the HarMean and then dividing that result by double the Elo range of the event (highest team’s Elo rating [EloHigh] minus lowest team’s rating [EloLow]). The exact formula for this can be seen below:
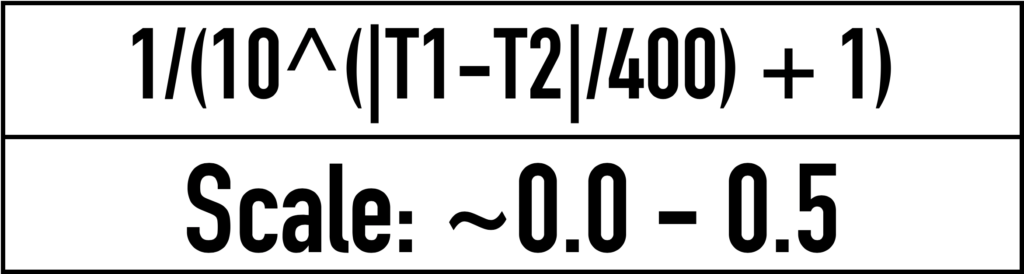
Matchup Closeness: For this, there’s already a scale that runs nicely from 0 (or as close to it as possible) to 0.5 (50 percent), and that is the predicted win probability of the matchup underdog. Since you use the underdog’s probability, by definition this scale maxes at 0.5—anything over that would mean they were no longer the underdog—when two teams have the exact same rating, and approaches zero asymptotically as the difference in the teams’s ratings gets very, very large. This value is calculated for every Elo calculation and prediction and is inherent in the Elo formula itself and is expressed using the formula below:
For any individual matchup, you can add these values together and multiply them by 100 to get the Excitement Index (EI) ranging from 0 and 100 that telling you how “exciting” a matchup is predicted to be. While it might be theoretically impossible to achieve a perfect 100—to do so, two teams would have to have the exact same Elo rating and be the highest-rated teams at the tournament—it can give you a pretty good idea of what games are worth watching. Any value above 70 will be one of that event’s best matchups, anything between 30-70 could be a decent game and anything below 30 would likely be worth passing on.
It should also be said that these indices would be calculated uniquely for each event, and thus would only act as a relative scale for games to watch at that event—or potentially for a whole weekend. For example, if the top three club teams were to play a round-robin tomorrow, the Texas Cavalry vs. The Warriors matchup would have an excitement index of 27.5, meanwhile, if across the country, the three lowest-rated college teams played another round-robin at the same time, the matchup between Appalachian State Quidditch and Wichita State University would have an excitement index of 95.3. That doesn’t mean the latter game would be more than three times more exciting than the former; each value is simply a basis of comparison for other games at the same event. If the six teams were playing at the same event, all three club matchups would have values greater than 65 and the highest-rated college matchup would be 51.3 (based almost solely on its closeness).
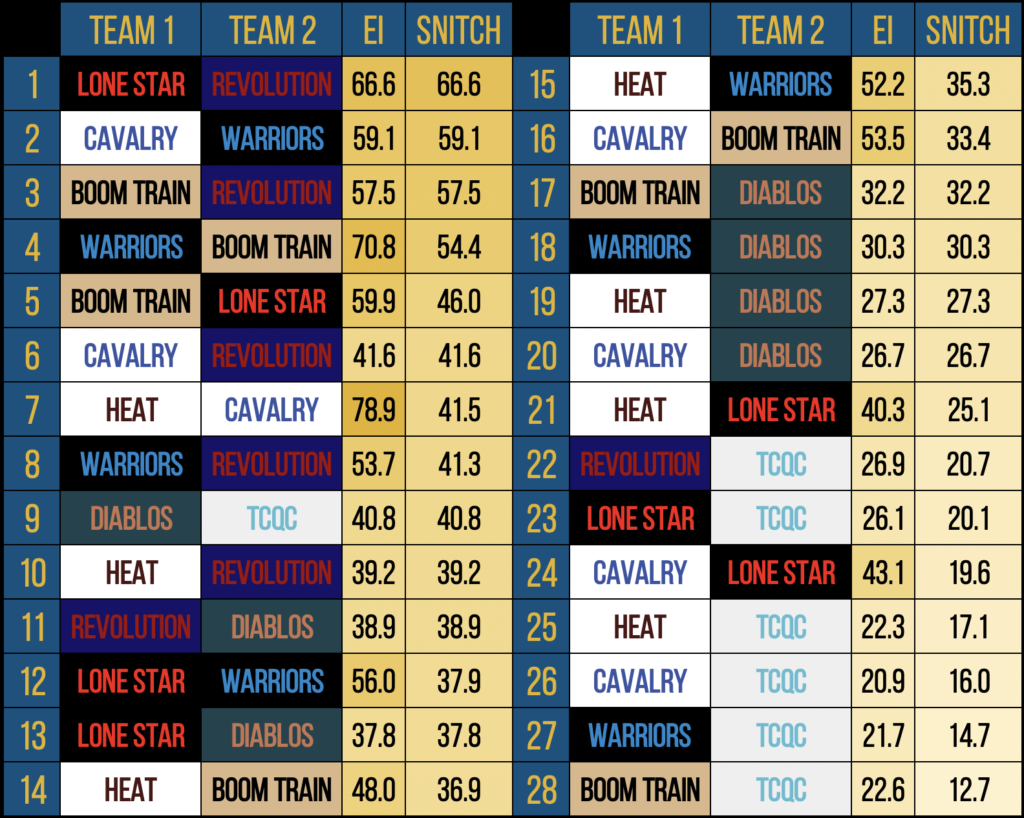
So, with only those two values, you can calculate the relative Excitement Index for any potential matchup, but what if you’re looking for new matchups? For example, at this weekend’s Crescent City Invitational, eight of the top teams in the country will be meeting in New Orleans. In the event, if Texas Cavalry were to play Lone Star Quidditch Club, that hypothetical matchup would have an EI of 43.1—better than roughly 57 percent of the other possible matchups to occur. One wouldn’t blame you for wanting to see the first Twin Cities Quidditch Club vs. Diablos Quidditch Club matchup instead of Lone Star and Cavalry’s 16th ever meeting, but the Twin Cities and Diablos matchup would have an EI of 40.8—theoretically a “worse” game than that between the two Texan neighbors.
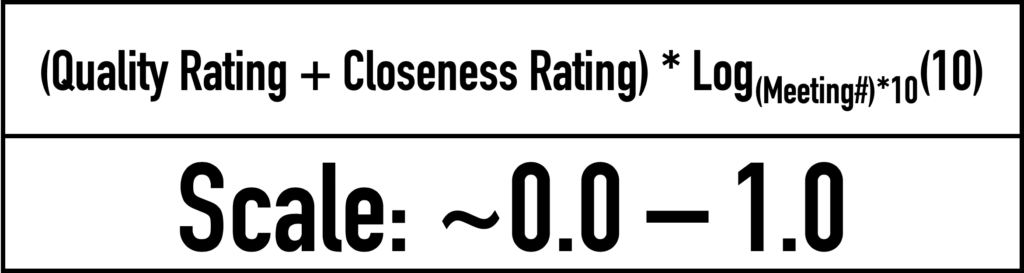
Matchup Uniqueness: To account for this, we created the Stratified Novelty Index Tracking Competitive Hierarchy (SNITCH) rating that features a multiplier benefiting more novel matchups. This multiplier takes the matchup number (Meeting#) and multiplies it by 10, then multiplies the EI by the log of 10 taken to the base of that calculated matchup number. That way a first-time matchup has a value of Log10(10), or 1, a second-time has a value of Log20(10), or 0.77, a third-time matchup has a value of Log30(10), or 0.68, and etc. The final SNITCH formula looks like this:
Using this transformation, the Lone Star vs. Cavalry matchup receives a SNITCH rating of 19.6, while the Diablos vs. Twin Cities matchup’s SNITCH rating remains 40.8. This multiplier can also be adjusted to weight rematches heavier or lighter as needed. A base rating of Log20(20) would penalize rematches less in this format, whereas a base rating of Log5(5) would penalize them more, and could be easily tweaked based on the preference of the tournament director and the nature of the event.
So why even make these ratings? Certainly every spectator will have their own intuitive set of interests when viewing matches that may overlap completely with this formula, or not at all. While tournament directors can still certainly publish EI or SNITCH ratings for their tournaments, this rating system is specifically useful in tournament planning or design. For large tournaments like regionals or nationals, tournament directors can look at predicted SNITCH ratings for deciding which games should be scheduled on an event’s marquee pitch and which games should be the focus of livestreams or limited HD film resources. Furthermore, they can use it to determine which matchups should be highlighted in advance of the event. For smaller tournaments, EI or SNITCH ratings could be used to predict all potential matchups at the event, and then pools could be designed to help maximize the most exciting matchups. For any tournament, the unadjusted EI should provide a decent proxy for determining which games should receive the higher quality officiating crews. This system finally provides a fair and objective way for determining which games should receive the limited resources and attention tournament directors can assign—without having to delve into diplomacy in explaining the subjective rationale behind why which games received what level of priority.
These ratings will certainly not be perfect—specifically in predicting upsets, which can be some of the most exciting games to observe. One of the most entertaining games I have ever observed, the 2014 LSU over Lost Boys upset, would have only had a predicted SNITCH rating of 33.3, yet it remains one of the most entertaining games from World Cup VII if not in quidditch history. That said, on average, EI and SNITCH ratings will help predict which games will be closest, and, thus should receive the most resources. Were upsets predictable in the first place, the very unexpectedness that makes them exciting would likely lose its luster.
Calculating these ratings. With the formulas laid out here and The Eighth Man’s Elo Standings, any tournament director should be able to use a simple spreadsheet file to calculate a matchup’s EI rating, and, with a past record of games, its SNITCH rating. However, should anyone need any help in calculating these, feel free to reach out to myself at my email, and I would be happy to help with consultation or calculation of these values in collaboration with The Eighth Man. While I cannot guarantee my help in providing these ratings for every event in the USQ season, The Eighth Man will likely be publishing EI and SNITCH ratings for major tournaments throughout the season. As an example, we’ve provided a table of all potential matchups for the Crescent City Invitational, taking place in New Orleans tomorrow.
Archives by Month:
- April 2025
- May 2023
- April 2023
- April 2022
- January 2021
- October 2020
- September 2020
- July 2020
- May 2020
- April 2020
- March 2020
- February 2020
- January 2020
- December 2019
- November 2019
- October 2019
- August 2019
- April 2019
- March 2019
- February 2019
- January 2019
- November 2018
- October 2018
- September 2018
- August 2018
- July 2018
- June 2018
- April 2018
- March 2018
- February 2018
- January 2018
- November 2017
- October 2017
- July 2017
- June 2017
- May 2017
- April 2017
- March 2017
- February 2017
- January 2017
- December 2016
- November 2016
- October 2016
- September 2016
- August 2016
- July 2016
- June 2016
- May 2016
- April 2016
- March 2016
- February 2016
- January 2016
- December 2015
- November 2015
- October 2015
- September 2015
- August 2015
- July 2015
- June 2015
- May 2015
- April 2015
- March 2015
- February 2015
- January 2015
- December 2014
- November 2014
- October 2014
- September 2014
- August 2014
- July 2014
- May 2014
- April 2014
- March 2014
- February 2014
- January 2014
- November 2013
- October 2013
- September 2013
- August 2013
- July 2013
- June 2013
- May 2013
- April 2013
- March 2013
- February 2013
- January 2013
- December 2012
- November 2012
- October 2012
Archives by Subject:
- Categories
- Awards
- College/Community Split
- Column
- Community Teams
- Countdown to Columbia
- DIY
- Drills
- Elo Rankings
- Fantasy Fantasy Tournaments
- Game & Tournament Reports
- General
- History Of
- International
- IQA World Cup
- Major League Quidditch
- March Madness
- Matches of the Decade
- Monday Water Cooler
- News
- Positional Strategy
- Press Release
- Profiles
- Quidditch Australia
- Rankings Wrap-Up
- Referees
- Rock Hill Roll Call
- Rules and Policy
- Statistic
- Strategy
- Team Management
- Team USA
- The Pitch
- The Quidditch Lens
- Top 10 College
- Top 10 Community
- Top 20
- Uncategorized
- US Quarantine Cup
- US Quidditch Cup