
- Rule, Britannia, no more?
- Unpopular Opinions: US Quadball Cup 2023
- Proven Contenders: University of Virginia
- Proven Contenders: Rutgers University
- Proven Contenders: University of Michigan
- Proven Contenders: Creighton University
- Different Perspectives: A Look Inside USA Ultimate
- Antwerp QC, Much of Belgian Core, Leaves Competitive Quidditch
Interregional Play by Numbers
- Updated: April 13, 2016

Credit: Jessica Jiamin Lang
The regular season is predominantly composed of intraregional play with most of the focus centered on the regional championship tournaments. While there are some tournaments that feature interregional components, such as Oktoberfest Invitational and Bat City, they are in the minority. At US Quidditch Cup, however, we shift to a focus on interregional play, while not having a clear understanding of how regions really stack up against each other.
To help create a better understanding of where things stand leading up to the main event, I have assembled a list of all of the cross-region games played between teams that qualified for US Quidditch Cup 9. However, to better understand the meaning of each game, I established an internal ranking for each region. This allowed me to compare the seeds from different areas.
The basic premise of this ranking was so that, by ranking teams within their own region first, I could see how a four seed from one region performed relative to a four seed from another. If there was perfect regional parity, you would expect each four seed to have equivalent performances, so, by looking at how their performances differ we can tease out the relative strength and depth of different regions.
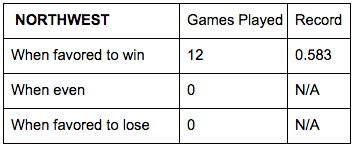
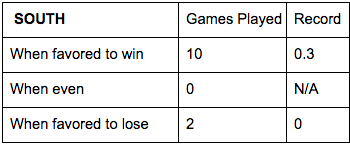
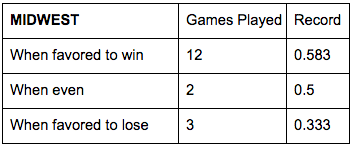
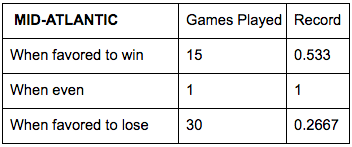
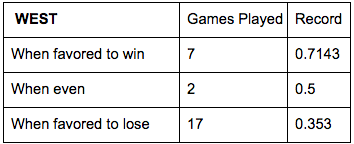
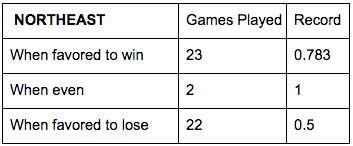
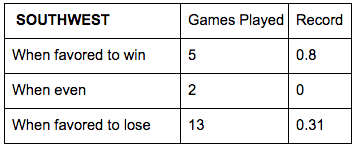
By looking at things on a region-by-region basis, I could sort all of the games played into three categories:
- Games where the home team was favored to win based on their in-region seed.
- Games where the teams had the same seed.
- Games where the home team was favored to lose based on their in-region seed.
To establish these internal rankings, I took two ordered lists, one based on USQ rankings and the other based on the team’s placement at their regional championship. I then averaged the team’s placements in both lists. The goal of this system was to rank teams in a manner that properly balanced their full body of work and their performance at crunch time against their in-region opponents.
An overview of the results can be found below. But if you want to look at the seeding and game data, you can find it all (here).
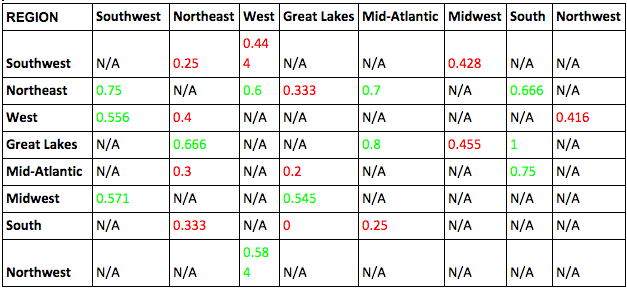
The above chart shows the raw win percentages for teams from each region against each other region. The percentages are from the perspective of the team on the left-hand column. Numbers in green denote a winning record, whereas red denotes a losing record.


