
- Rule, Britannia, no more?
- Unpopular Opinions: US Quadball Cup 2023
- Proven Contenders: University of Virginia
- Proven Contenders: Rutgers University
- Proven Contenders: University of Michigan
- Proven Contenders: Creighton University
- Different Perspectives: A Look Inside USA Ultimate
- Antwerp QC, Much of Belgian Core, Leaves Competitive Quidditch
Don’t Enter Nationals Ranked Fifth
- Updated: April 11, 2018
You asked; we answered.
Two weeks ago, CJ Junior (@HypocriCJ) asked the following:
This graph supports the idea that having the strongest ELO doesn’t correlate significantly to winning a championship. I’d love more data on how ELO contributes to finishes at nationals period. https://t.co/puXuaR1zLg
— C.J. Junior (@HypocriCJ) March 26, 2018
It’s an interesting question, and one that doesn’t necessarily have a straightforward answer. An oversimplified method would just be to look at what a team’s Elo rating was before and after Nationals, calculate the difference—keeping in mind your chronic overperformers and underperformers—then calculate the totals and averages, which we did here*.
However, there are some big issues with that method. First and foremost, even when you control for first-year teams consistently outperforming their rating (note the performances by the BosNYan Bearsharks, Arizona Quidditch Club and Blue Mountain Quidditch Club), this system is heavily weighted towards teams that come in with high rankings. In most pool-to-bracket Nationals, a high-ranked team will get four wins in pool play, go on to win their first round of bracket and start the tournament 4-0 or 5-0. For example, the Lost Boys entered World Cup 7 as the second-highest-rated team and went 4-0 in pool play before being upset in the Round of 32 by No. 30 LSU in one of the most disappointing performances in World Cup/USQ Cup history. Despite their finish, however, the Lost Boys overperformed their tournament-starting Elo rating by 44 points. This is due in large part to their dominant pool play run in what was overall a 4-1 experience. Thus, that table is headed by teams like the University of Texas, Texas Cavalry and Texas State University that consistently make deep bracket runs. If you’re the highest-rated team going into Cup and you bow out in the quarterfinals, a jump in your Elo rating will be a hollow victory in comparison to expectations.
To account for this expectation game, we have to look at where a team ranks in Elo ratings before Nationals and where that team finishes in bracket play. For example, if the highest-rated team finishes in the semifinals, they’ve underperformed by 2.5 places (a semifinal performance is scored as 3.5, an average of the third and fourth place finishes). If the 14th highest-rated team doesn’t make a 36-team bracket, they’ve underperformed by at least 23 places. When we look at our historical records, we get the below graph.
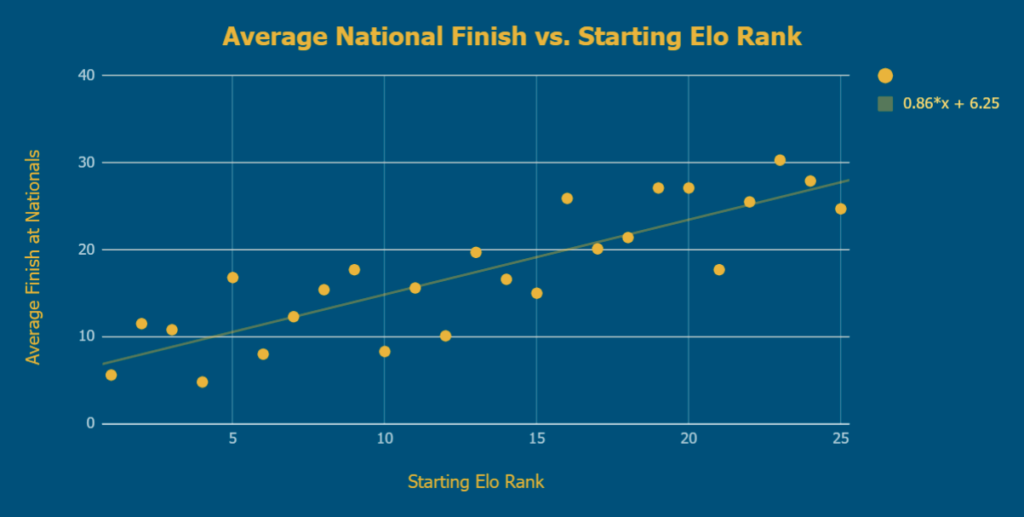
While five Cups is a relatively small dataset, a steady trendline emerges. While it has some interesting data points (the fifth-ranked team, on average, doesn’t even make the Sweet 16; the fourth-ranked team, on average, does better than the highest-ranked team, etc.), these are likely just noise in a trend that tells us what we already know: Better teams tend to do better at Nationals.
To make this truly interesting, we need to break it down on a team-by-team basis to see who overperforms and who underperforms in bracket. Doing this based solely on rankings can result in some noisy data (a team finishing 34th when they were ranked 35th has not done just as well as a team who finished first when they were ranked second), but, fortunately, Elo gives us a great way to compare.
We can compare a team’s pre-Cup Elo to the pre-Cup Elo associated with the rank where they finished to give us a good proxy for how well they tend to do at Cup. If a team won, we would compare its Elo rating going into Cup with the Elo rating of the highest-rated team pre-Cup. If a team finished in the quarterfinals, we would compare their initial Elo rating to the averages of the fifth-through-eighth-ranked teams to judge their performance.
For example, if the top team going into Nationals has an Elo rating of 1900 points, but the team that wins comes into Cup with an Elo rating of 1750, they would have overperformed by +150 points. Meanwhile, if that top-rated team finishes in the semifinals, and the third-and-fourth-rated teams have ratings of 1850 and 1800, respectively, the top-rated team would have underperformed by 75 points ([1850+1800]/2 – 1900). Without getting too bogged down in the math, you can view the full table of teams that have ever made (or that underperformed by missing) bracket play here.

Credit: Isabella Gong
Unsurprisingly, the four best performances have all been managed by first-year teams, which Elo notoriously tends to under-rank: Arizona Quidditch Club, Blue Mountain, Bearsharks and Long Beach Funky Quaffles. Following these are Texas State’s World Cup 7 final appearance as the 23rd-ranked team; Michigan State University’s World Cup 8 Sweet 16 appearance as the 42nd-ranked team; and Southern Storm’s USQ Cup 9 Round of 32 appearance as the 65th-ranked team. Rounding out the bottom are three Round of 32 finishes: the Lost Boys at World Cup 7 as the second-ranked team; University of Michigan at USQ Cup 9 as the third-ranked team; and University of Miami at World Cup 6 as the second-ranked team.
As consistent overperformers go, Crimson Elite and Ohio State University are the only teams to ever overperform their pre-Cup Elo by more than 40 points on three occasions. Meanwhile, the University of Maryland is the only team to ever underperform by more than 100 on more than two separate occasions, and Tufts University is the only team on the list to have underperformed at every Cup we have data on.
Going into Nationals, it’s hard to say which teams will be able to defy their odds and over perform, but if the curse of being the fifth-rated team continues, Lone Star Quidditch Club (No. 5 in club teams) and University of Kansas (No. 5 in college teams) should watch their backs.


