- Rule, Britannia, no more?
- Unpopular Opinions: US Quadball Cup 2023
- Proven Contenders: University of Virginia
- Proven Contenders: Rutgers University
- Proven Contenders: University of Michigan
- Proven Contenders: Creighton University
- Different Perspectives: A Look Inside USA Ultimate
- Antwerp QC, Much of Belgian Core, Leaves Competitive Quidditch
Breaking Down the USQ Cup 9 Final
- Updated: May 11, 2016
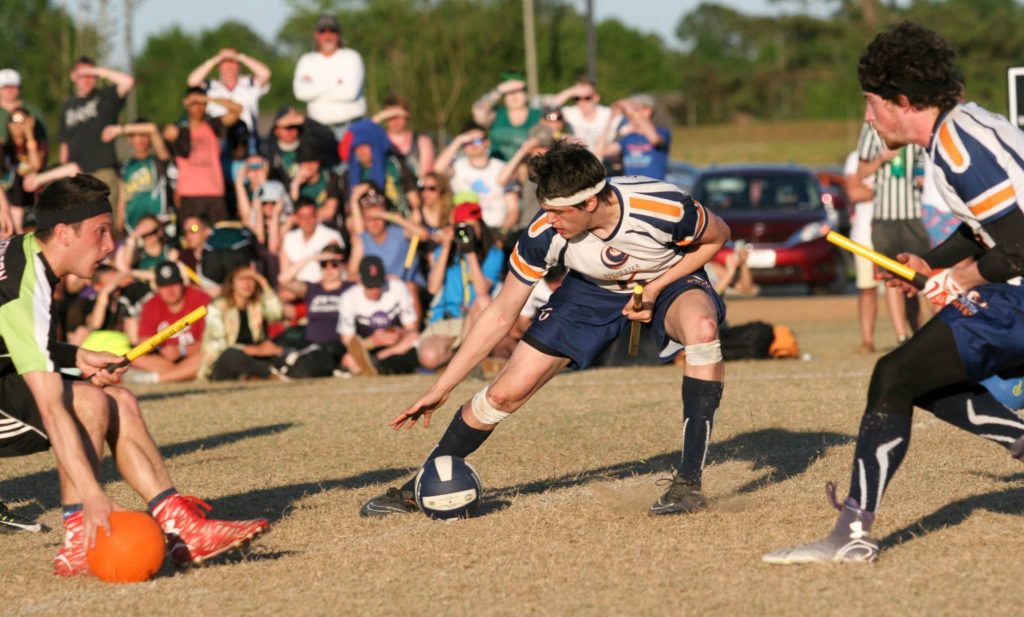
Credit: Matt Dwyer
US Quidditch Cup 9 came to a close with one of the most exciting finals the sport has seen: a Northeast Regional Championship rematch between Quidditch Club Boston and Rochester United. MLQ Statistics Coordinator Joshua Mansfield breaks down the box score stats behind the game and what they reveal. All chaser stats were collected by MLQ Gameplay Analyst Shane Hurlbert, and all beater stats were collected by Mansfield.
CHASER STATS
Stats Tracked: Goals, Shots, Assists, Turnovers, Takeaways, Blocks, Penalties
Stat Description: Most of these are fairly straightforward. A player earns a turnover any time their action causes the quaffle to be turned over to the other team (i.e. bad pass, being beat, missed shot, etc.). A player earns a takeaway any time their action directly results in their team gaining quaffle possession from the other team. A shot is counted any time a ball scores a goal, even if the ball does not leave the hand of the player before it scores (in the case of dunks).
Standout Players: Shane Hurlbert (Rochester United) -> 6 goals, 2 assists, 5 blocks
Jayke Archibald (Quidditch Club Boston) -> 3 goals, 2 assists, 1 block, 1 takeaway
Kara Levis (Quidditch Club Boston) -> 3 goals, 0 turnovers
Summary: These chaser stats paint a fairly clear picture. On Rochester’s side, the offense ran almost entirely through Shane Hurlbert. Hurlbert scored six of their nine goals and followed through with two additional assists, resulting in his involvement in an insane 89% of United’s scoring plays. The fact that Hurlbert took 12 of his team’s 17 total shots indicates how heavily their offense relied on him, although his shooting percentage ended up a very mediocre 50%. The Kobe of his team, Hurlbert took shots early and often, yet was still able to sink enough to keep them competitive. His six turnovers—most of them on missed shots—also led the team, but he made up for them defensively, leading the team with five blocks.
Compared to Rochester’s efforts, Boston put up a much more even-handed offensive performance. Boston had six players with at least two goals (Archibald, Jules Baer, Dom Bailey, David Fox, Harry Greenhouse and Levis) and none with more than three. Boston also went 14 for 22 (64%) on shots, whereas Rochester lagged behind in shooting, going nine for 17 (54%). Takeaways in this game were notably low on both sides, with most changes in possession either occurring due to missed shots or goals.
For stats purposes, Boston keeper Tyler Trudeau’s tactical own goal in overtime to remove their seeker from the penalty box was not counted.
BEATER STATS
Stats Tracked: Drives played, +/-, Turnovers Forced, Control Lost, Control Gained, No Bludger Scenarios Forced (0 Forced), No Bludger Scenarios Converted (0 Conv.), Beats Stopped, Blocks, Catches, Dodges, Beats, Beat Attempts, Average Beat Range (ABR)
Stat Description: All stats are defined here.
Standout Players: Max Havlin (Quidditch Club Boston) -> +/- per Drive: +2.5, 0 Forced: 6, 0 Conv: 5, Catches: 4, ABR: 1.69
Kyle Savarese (Rochester United) -> +/- per Drive: +1.0, Beat Percentage: 92%, ABR: 1.46
Summary: When you break down these stats, you start to get a sense of the beater talent present in this final. Havlin’s ability to create opportunities for Boston on offense is evident in his six no bludgers forced, five of which were converted for goals, or 36% of all of the goals Boston scored. Furthermore, both teams had incredible beat stoppage stats. As a team, Rochester’s beaters either blocked, dodged or caught 17 bludgers, and Boston’s beaters were able to keep pace, collectively stopping 10 bludgers. This stat becomes even more impressive when you realize that only 10 of Rochester’s 64 beats (16%) and 20 of Boston’s 83 (24%) did not make contact. That means that every beat Rochester threw was on target, and their only misses came from Boston’s beaters blocking, catching or dodging their throws, as mentioned earlier. An astounding 80 of Boston’s 83 beats were on target, as well.
When people look at this match and note that elite beater play has taken a step forward in the 2015-16 season, this is a large part of what they mean. Of the 147 beats thrown in this game, only three (2%) were off target, and opposing beaters defended an astounding 27. At the elite end of the game, off-target throws have been nearly eliminated, and, to adapt, top-level beaters are needing to rapidly improve at their ability to stop these bludgers from hitting them.
You can find the raw data of Mansfield and Hurlbert’s work here. These stat methods and metrics were developed by the statistics team at Major League Quidditch.
